At a coaching conference a while back, I listened to some very experienced triathlon coaches speak about Ironman training. According to these coaches, the TSS (Training Stress Score) numbers that TrainingPeaks can calculate are solid enough for them to say with some conviction that to complete the world championship race in Kona in under 9 hours, a triathlete needs a CTL (Chronic Training Load) of 150. They also had enough data to produce similar benchmarks for other races and marathon times. This got me thinking: Would it be possible to establish a CTL yardstick in TrainingPeaks for the mountain athletes we coach?
What follows is a deep dive into how we came up with our Uphill Athlete–specific adjustments to the TSS and hence all the other TrainingPeaks metrics. Let’s start with some definitions.
CTL and TSS Defined
Chronic Training Load (CTL) is a decent proxy for fitness, but it is still a proxy. Keep in mind that like any proxy (using growth ring data as a proxy for ancient climate, for example), CTL distills a lot of information down to one number. The accuracy of that number relies on the models used to derive it. In TrainingPeaks, CTL is calculated via a proprietary backward-looking algorithm that takes into account the TSS of each workout done over the past six weeks, weighting workouts done most recently significantly more heavily than those done 40 days ago. This is a form of nonlinear weighting. But the CTL model is only as accurate as the TSS inputs.
Training Stress Score (TSS) is meant to reflect the training load from an individual workout. TSS is most accurate when based on power (pTSS), as in cycling with a power meter. Pace (rTSS), the ideal metric for road and track racers, ranks a close second. Because power is a direct measure of the rate of work being done, it is an almost perfect reflection of the training load. Pace similarly gives a very good idea of the actual work being done. These more accurate TSS values result in a CTL that gives a better gauge of fitness.
Using Heart Rate to Determine TSS for Mountain Athletes
For a sport like the triathlon, where coaches who use the TrainingPeaks metrics have collected millions of data points on tens of thousands of athletes, the CTL proxy is fairly likely to be accurate—maybe to within 90 percent. Thus their assertion that it is not possible to break 9 hours in an Ironman triathlon without a certain level of work capacity (i.e., a CTL of 150), assuming the work capacity has been developed in ways specific to the triathlon. These coaches can then use that work capacity score as a guideline for preparing clients for similar events.

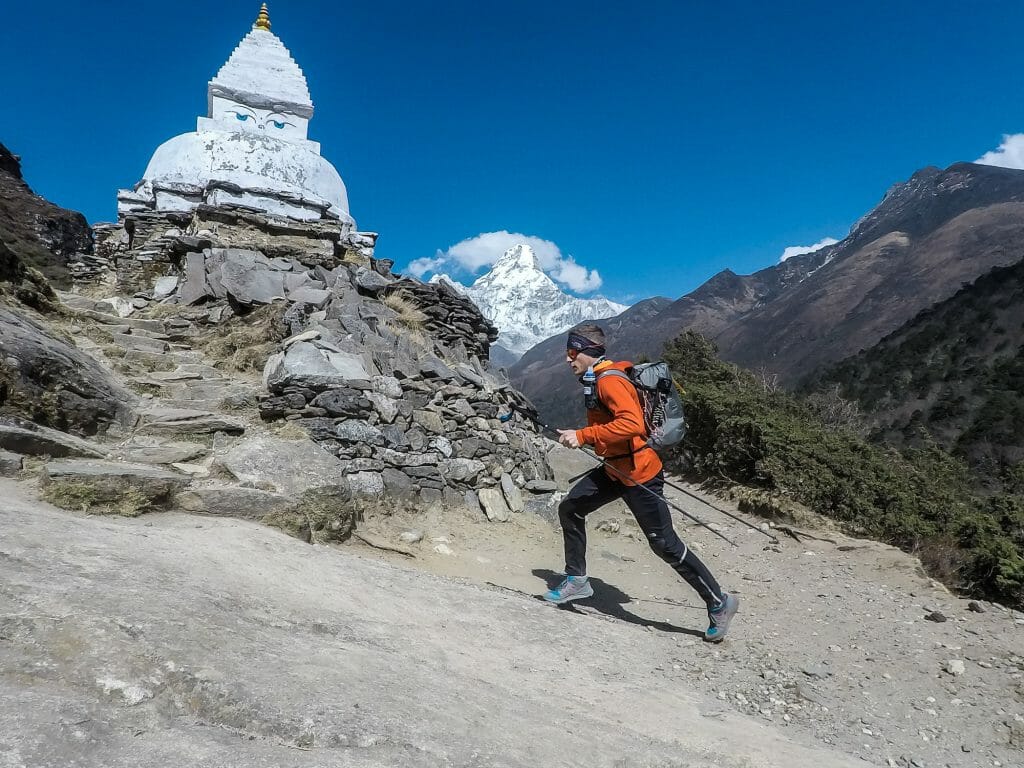
David Goettler training in the Khumbu Region, Nepal.
For mountain athletes training on undulating terrain and often using different training modes (running, hiking, skiing), power meters are not very accurate. As of this writing, even the newer running ones cannot be relied upon. Pace is similarly useless. That leaves us with the least accurate option: using heart rate to determine TSS.
Heart rate is an imperfect measure of training load. On flat ground and in the aerobic realm (under AnT/LT), the relation of heart rate to load is linear; there it can do a decent job of reflecting TSS. However, as soon as you add a significant muscular strength/endurance component, such as a bunch of vertical, a backpack full of climbing gear, or heavy touring skis and boots, heart rate no longer gives a very accurate assessment of TSS because TSS is the combined stress of the workout: metabolic stress, cardiovascular stress, and local muscular fatigue. For example, heart rate does a poor job of capturing the neuromuscular loading of downhill running, where your heart rate will be relatively low but your legs can get really beat up. This inaccuracy in hrTSS leads to inaccurate CTL results from the TrainingPeaks algorithm for the aerobic training.
When it comes to strength workouts, hrTSS is meaningless because heart rate is no indication of how hard a strength workout is.
hrTSS "Fudge Factors"
So what is an uphill athlete to do? It’s not a perfect solution, but I and the other coaches at Uphill Athlete introduce specific fudge factors into the hrTSS scores for daily workouts. Note: For the sake of comparing your workouts, it is important to remain consistent in how you apply these fudge factors. That way you will always be comparing apples to apples.
Here is the system we have developed, broken down by workout type:
A purely aerobic run/hike/ski while carrying no to minimal weight:
Calculate the TrainingPeaks hrTSS and add 10 TSS for each 1,000 vertical feet of gain.
A purely aerobic run/hike/ski while carrying more than 10 percent of body weight:
Add 20 TSS/1,000 feet.
Muscular endurance (ME):
A hard muscular workout, such as an uphill ME workout, typically has a very high local muscular endurance factor at a (disappointingly) low heart rate. To determine TSS, pick a number that reflects the recovery time before you feel ready for another such workout. For slow twitch muscle fiber–dominant athletes, these ME workouts take a big toll and require 72 hours of recovery, during which time only easy aerobic work is done. If that is you, score your ME workouts at 150–200 TSS. Fast twitch–dominant athletes, those with a lot of strength training or sprinting in their backgrounds, are able to handle these ME workouts more easily and can bounce back in 48 hours. If you fall into this camp, give your ME workouts 100 TSS.
Training for the New Alpinism general strength and core workout:
Give this a TSS of 50–70/hour.
TftNA max strength with core warm-up:
Give this a TSS of 80–90/hour.
Climbing workouts:
At Uphill Athlete, we consider climbing sessions to be strength training. As mentioned above, the TrainingPeaks metrics do not accurately reflect strength training sessions, especially when using hrTSS, because heart rate is a poor proxy for effort.
- General strength: 50 TSS/hour
- Max strength: 75–80 TSS/hour
- ARC training (below onsight level): 50 TSS/hour; count only time on the rock.
- ARC training (at or near max level): 80–100 TSS/hour; count only time on the rock.
Perhaps these fudge factors seem arbitrary and too formulaic to apply across broad swaths of athletes, but they reflect actual workload and recovery times pretty well. While it takes a lot of time for us to fudge the numbers daily for all of the athletes we coach, we feel it is worth it, especially when it comes to assessing a client’s fitness and preparedness for a given undertaking. Fudge factors aside, the TrainingPeaks metrics represent the best fitness and recovery monitoring tool I have come across in 30-some years of coaching. Although I was highly skeptical of the program when I first started using it, I am now convinced that with suitable modification it works quite well.

What We Know and What We Don't Know
Here at Uphill Athlete we have hundreds if not thousands of TSS data points. While trends are visible, the accuracy of our predictive model—predicting fitness levels for objectives—is probably below 75 percent. Having coached many dozens of athletes over many years, I am able to say that 100 is pretty much the price of admission for an O2-assisted ascent of an 8,000-meter peak. And those with a CTL of 40–50 are not ready for big mountain adventures. But whether you need 120 or 130 for success on Everest, I can’t say with much certainty.
As we accumulate more data and experience, we hope to improve our predictive model. However, there are some big hurdles we may never overcome in terms of developing a more accurate predictive tool, namely our reliance on hrTSS, the least accurate way of calculating the overall stress of training. When you layer on the fudge factors, our TSS numbers need to be taken with a big grain of salt. They are rough estimates and only work when comparing apples to apples. They are an imperfect solution—and also the best possible one.
For more about metrics in TrainingPeaks, see Explanation and Tour of TrainingPeaks’ Performance Management Chart.

